A few months ago, Kontext enabled individual level content analytics (refer to Data Analytics for your Kontext Posts). From today, Kontext users can view the summary report of all your content on Kontext incl. column articles, diagrams and forum threads.
Eligibility
Available only to Kontext registered users who have published content on our platform.
How to view it
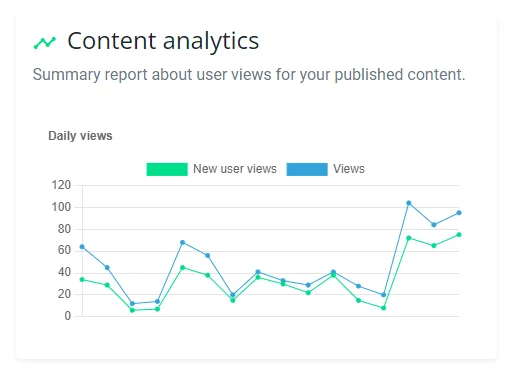
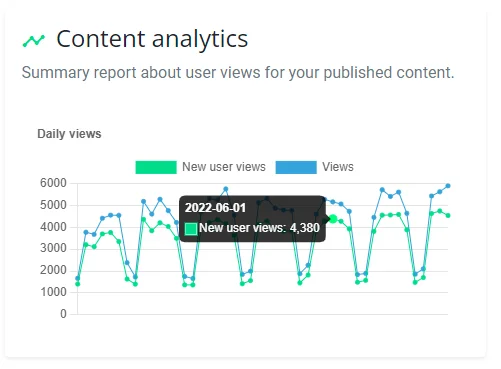
The chart will automatically display on My dashboard page after you logon. The following are some examples:


We hope these charts can help you understand how users are engaging with your published content on Kontext. There will be more analytical features released in future. If you have any feedbacks or suggestions, feel free to post a comment or contact us via email.