Apache Arrow is an in-memory columnar data format that can be used in Spark to efficiently transfer data between JVM and Python processes.
This currently is most beneficial to Python users that work with Pandas/NumPy data.
In this article, I'm going to show you how to utilise Pandas UDF in Spark to improve performance. Apache Arrow helps to reduce data copy/serialization between JVM and Python processes as the following diagram shows:

Prerequisite

*The above logos are trademarks of the Apache Software Foundation (ASF) for Apache Spark and Apache Arrow.
Apache Spark 2.3+
If you don't have Spark available, you can follow these installation guides:
Apache Spark 2.4.3 Installation on Windows 10 using Windows Subsystem for Linux
Install Spark 2.2.1 in Windows
Apache Arrow
Other references
PySpark Usage Guide for Pandas with Apache Arrow
Environment for this article
All the code provided in this article runs in the following environment:
| Item | Value |
|---|---|
| OS | WSL (Windows Subsystem for Linux) Distro: Distributor ID: Ubuntu Description: Ubuntu 18.04.1 LTS Release: 18.04 Codename: bionic |
| Hadoop | 3.2.0 *Link to installation guide. |
| Spark | 2.4.3 *Link to installation guide. |
| PyArrow | 0.8.0 Installed using the following command: <br>sudo pip install pyarrow==0.8.0<br> |
Scenario
The official documentation (included in Reference section) provides very detailed explanation about this feature and I won't repeat again in this article.
The following code snippet performs the following actions:
- Construct a Spark data frame in memory directly. The data frame looks like the following:
+----------+-------------+------+-------------+
|CustomerID|TransactionID|Amount|CreditOrDebit|
+----------+-------------+------+-------------+
|         0|            0|  0.00|       Credit|
|         1|            0|  0.00|       Credit|
|         2|            0|  0.00|       Credit|
|         3|            0|  0.00|       Credit|
|         4|            0|  0.00|       Credit|
....
|         4|            1| -0.71|        Debit|
|         5|            1| -2.76|        Debit|
|         6|            1| -4.07|        Debit|
|         7|            1| -4.31|        Debit|
|         8|            1| -2.73|        Debit|
|         9|            1| -3.24|        Debit|
+----------+-------------+------+-------------+
- Create a group map function using the old approach (without Apache Arrow). It first uses groupbyfunction to group all the transactions to a new list column named Transactionsby CustomerIDand then apply the UDF to create a attribute named EnrichedTransactions with a new attribute named Diff. Before the dataframe is exploded, it looks like the following:
+----------+--------------------+--------------------+
|CustomerID|        Transactions|EnrichedTransactions|
+----------+--------------------+--------------------+
|         1|[[0, 0.00, Credit...|[[0, 0.00, Credit...|
|         6|[[0, 0.00, Credit...|[[0, 0.00, Credit...|
|         3|[[0, 0.00, Credit...|[[0, 0.00, Credit...|
|         5|[[0, 0.00, Credit...|[[0, 0.00, Credit...|
|         9|[[0, 0.00, Credit...|[[0, 0.00, Credit...|
|         4|[[0, 0.00, Credit...|[[0, 0.00, Credit...|
|         8|[[0, 0.00, Credit...|[[0, 0.00, Credit...|
|         7|[[0, 0.00, Credit...|[[0, 0.00, Credit...|
|         2|[[0, 0.00, Credit...|[[0, 0.00, Credit...|
|         0|[[0, 0.00, Credit...|[[0, 0.00, Credit...|
+----------+--------------------+--------------------+
The dataframe is then exploded which prints out the following:
+----------+-------------+------+-------------+------+
|CustomerID|TransactionID|Amount|CreditOrDebit|  Diff|
+----------+-------------+------+-------------+------+
|         1|            0|  0.00|       Credit|  0.30|
|         1|            1|  0.47|       Credit|  0.77|
|         1|            2|  0.97|       Credit|  1.27|
....
|         1|            5| -1.11|        Debit| -0.81|
|         1|            6| -1.05|        Debit| -0.75|
|         1|            7|  3.63|       Credit|  3.93|
|         1|            8| -6.03|        Debit| -5.73|
- The third function is an aggregate function which returns the mean value for transaction amount. The dataframe looks like the following before explosion.
+----------+--------------------+------+
|CustomerID|             Amounts|  Mean|
+----------+--------------------+------+
|         1|[0.00, 0.47, 0.97...| -0.30|
|         6|[0.00, -4.07, 4.7...| 32.45|
|         3|[0.00, -1.61, -3....| -3.89|
|         5|[0.00, -2.76, -0....| 13.48|
|         9|[0.00, -3.24, -12...|  0.00|
|         4|[0.00, -0.71, 5.1...| 12.67|
|         8|[0.00, -2.73, 9.0...|-17.43|
|         7|[0.00, -4.31, -10...| 11.74|
|         2|[0.00, 0.01, -1.1...|  3.39|
|         0|[0.00, 0.00, 0.00...|  0.00|
+----------+--------------------+------+
Code snippet (without Apache Arrow)
from pyspark import SparkConf
from pyspark.sql import SparkSession, Window
from pyspark.sql.types import ArrayType, StructField, StructType, StringType, IntegerType, DecimalType, FloatType
from pyspark.sql.functions import udf, collect_list, struct, explode
from decimal import Decimal
import random
import pandas as pd
import numpy as np

appName = "Python Example - Apache Arrow Example"
master = 'local'

# Create Spark session
conf = SparkConf().setMaster(master)
spark = SparkSession.builder.config(conf=conf) \
    .getOrCreate()

# Enable Arrow optimization and fallback if there is no Arrow installed
spark.conf.set("spark.sql.execution.arrow.enabled", "true")
spark.conf.set("spark.sql.execution.arrow.fallback.enabled", "true")

# Construct the data frame directly (without reading from HDFS)
cust_count = 10
txn_count = 100
data = [(i, j, Decimal(i*j*random.random()*random.choice((-1, 1)))) for j in range(txn_count)
        for i in range(cust_count)]

# Create a schema for the dataframe
schema = StructType([
    StructField('CustomerID', IntegerType(), False),
    StructField('TransactionID', IntegerType(), False),
    StructField('Amount', DecimalType(scale=2), True)
])

# Create the data frame
df = spark.createDataFrame(data, schema=schema)

# Function 1 - Scalar function - dervice a new column with value as Credit or Debit.

def calc_credit_debit_func(amount):
    return "Credit" if amount >= 0 else "Debit"

fn_credit_debit = udf(calc_credit_debit_func, returnType=StringType())

df = df.withColumn("CreditOrDebit", fn_credit_debit(df.Amount))
df.show()

# Function 2 - Group map function - calculate the difference from mean
attributes = [
    StructField('TransactionID', IntegerType(), False),
    StructField('Amount', DecimalType(scale=2), False),
    StructField('CreditOrDebit', StringType(), False),
    StructField('Diff', DecimalType(scale=2), False)
]
attribute_names = [a.name for a in attributes]

@udf(ArrayType(StructType(attributes)))
def fn_calc_diff_from_mean(txn):
    dict_list = [row.asDict() for row in txn]
    pdf = pd.DataFrame(dict_list)
    amount = pdf.Amount
    pdf = pdf.assign(Diff=amount-Decimal(amount.mean()))
    return [[r[attr] if attr in r else None for attr in attribute_names] for r in pdf.to_dict(orient='records')]

df_map = df.groupby("CustomerID")\
    .agg(collect_list(struct(['TransactionID', 'Amount', 'CreditOrDebit'])).alias('Transactions')) \
    .withColumn("EnrichedTransactions", fn_calc_diff_from_mean("Transactions"))
df_map.show(10)
df_map_expanded = df_map.withColumn("transactions_exploded", explode("EnrichedTransactions")) \
    .select("CustomerID", "transactions_exploded.*")
df_map_expanded.show(100)

# Function 3 - Group aggregate function - calculate mean only
@udf(DecimalType(scale=2))
def mean_udf(amount):
    return np.mean(amount)

df_agg = df.groupby("CustomerID").agg(collect_list("Amount").alias("Amounts"))\
    .withColumn("Mean", mean_udf("Amounts"))
df_agg.show()
Improve the code with Pandas UDF (vectorized UDF)
Since Spark 2.3.0, Pandas UDF is introduced using Apache Arrow which can hugely improve the performance. Now we can change the code slightly to make it more performant. For some scenarios, it can be as simple as changing function decorations from udfto pandas_udf.
Add the following configurations before creating SparkSession:
# Enable Arrow optimization and fallback if there is no Arrow installed
spark.conf.set("spark.sql.execution.arrow.enabled", "true")
spark.conf.set("spark.sql.execution.arrow.fallback.enabled", "true")
For Function 1, we need to make the following change:
- Change code to use pandas_udf function.
- Change the calculation function to return a new pandas.Series instance since scalar function's input is now pandas.Series and it requires return a series with same length.
# Function 1 - Scalar function - dervice a new column with value as Credit or Debit.

def calc_credit_debit_func(amount):
    return pd.Series(["Credit" if a >= 0 else "Debit" for a in amount])

fn_credit_debit = pandas_udf(
    calc_credit_debit_func, returnType=StringType())

df = df.withColumn("CreditOrDebit", fn_credit_debit(df.Amount))
df.show()
The output is similar as the one without Arrow:
+----------+-------------+-----------+-------------+
|CustomerID|TransactionID|     Amount|CreditOrDebit|
+----------+-------------+-----------+-------------+
|         0|            0|       -0.0|       Credit|
|         1|            0|       -0.0|       Credit|
|         2|            0|        0.0|       Credit|
|         3|            0|       -0.0|       Credit|
......
|         3|            1|  2.4686418|       Credit|
|         4|            1| -0.2355775|        Debit|
|         5|            1|   2.459984|       Credit|
|         6|            1|  0.0441572|       Credit|
|         7|            1| -4.6926293|        Debit|
|         8|            1|  7.3360023|       Credit|
|         9|            1|   -6.19338|        Debit|
+----------+-------------+-----------+-------------+
For Function 2, all the attributes in each group will be passed as pandas.DataFrame object to the UDF. To handle this, we change the UDF's schema accordingly. The data type for Amount is also changed from DecimalType to FloatType to avoid data type conversions. Now the code is simpler since we can easily operate on pandas DataFrame:
# Function 2 - Group map function - calculate the difference from mean
attributes = [
    StructField('CustomerID', IntegerType(), False),
    StructField('TransactionID', IntegerType(), False),
    StructField('Amount', FloatType(), False),
    StructField('CreditOrDebit', StringType(), False),
    StructField('Diff', FloatType(), False)
]
attribute_names = [a.name for a in attributes]

@pandas_udf(StructType(attributes), PandasUDFType.GROUPED_MAP)
def fn_calc_diff_from_mean(txn):
    pdf = txn
    amount = pdf.Amount
    pdf = pdf.assign(Diff=amount - amount.mean())
    return pdf

df_map = df.groupby("CustomerID").apply(fn_calc_diff_from_mean)
df_map.show(100)
The output looks like the following:
+----------+-------------+-----------+-------------+-----------+
|CustomerID|TransactionID|     Amount|CreditOrDebit|       Diff|
+----------+-------------+-----------+-------------+-----------+
|         1|            0|        0.0|       Credit| -6.8858156|
|         1|            1|-0.37577832|        Debit|  -7.261594|
|         1|            2| 0.24907039|       Credit| -6.6367455|
|         1|            3| 0.14998765|       Credit|  -6.735828|
|         1|            4|  2.9994483|       Credit| -3.8863673|
|         1|            5| -2.8604903|        Debit|  -9.746305|
.....
|         1|           97| -25.346855|        Debit|  -32.23267|
|         1|           98|  55.890533|       Credit|   49.00472|
|         1|           99|  57.929718|       Credit|  51.043903|
+----------+-------------+-----------+-------------+-----------+
For Function 3, we can simply change the function decorations:
# Function 3 - Group aggregate function - calculate mean only
@pandas_udf(FloatType(), PandasUDFType.GROUPED_AGG)
def mean_udf(amount):
    return np.mean(amount)

df_agg = df.groupby("CustomerID").agg(mean_udf(df['Amount']).alias("Mean"))
df_agg.show()
The output looks like the following:
+----------+-----------+
|CustomerID|       Mean|
+----------+-----------+
|         1|-0.51876295|
|         6| -7.9901357|
|         3| -8.7103615|
|         5|    42.3303|
|         9|  22.456985|
|         4|  11.116367|
|         8|  -21.63057|
|         7|   17.32074|
|         2|-0.86947787|
|         0|        0.0|
+----------+-----------+
Complete code snippet (with Apache Arrow)
from pyspark import SparkConf
from pyspark.sql import SparkSession, Window
from pyspark.sql.types import ArrayType, StructField, StructType, StringType, IntegerType, DecimalType, FloatType
from pyspark.sql.functions import udf, collect_list, struct, explode, pandas_udf, PandasUDFType, col
from decimal import Decimal
import random
import pandas as pd
import numpy as np

appName = "Python Example - UDF with Apache Arrow (Pandas UDF)"
master = 'local'

# Create Spark session
conf = SparkConf().setMaster(master)
spark = SparkSession.builder.config(conf=conf) \
    .getOrCreate()

# Enable Arrow optimization and fallback if there is no Arrow installed
spark.conf.set("spark.sql.execution.arrow.enabled", "true")
spark.conf.set("spark.sql.execution.arrow.fallback.enabled", "true")

# Construct the data frame directly (without reading from HDFS)
cust_count = 10
txn_count = 100
data = [(i, j, i * j * random.random() * random.choice((-1, 1)))
        for j in range(txn_count) for i in range(cust_count)]

# Create a schema for the dataframe
schema = StructType([
    StructField('CustomerID', IntegerType(), False),
    StructField('TransactionID', IntegerType(), False),
    StructField('Amount', FloatType(), True)
])

# Create the data frame
df = spark.createDataFrame(data, schema=schema)

# Function 1 - Scalar function - dervice a new column with value as Credit or Debit.

def calc_credit_debit_func(amount):
    return pd.Series(["Credit" if a >= 0 else "Debit" for a in amount])

fn_credit_debit = pandas_udf(calc_credit_debit_func, returnType=StringType())

df = df.withColumn("CreditOrDebit", fn_credit_debit(df.Amount))
df.show()

# Function 2 - Group map function - calculate the difference from mean
attributes = [
    StructField('CustomerID', IntegerType(), False),
    StructField('TransactionID', IntegerType(), False),
    StructField('Amount', FloatType(), False),
    StructField('CreditOrDebit', StringType(), False),
    StructField('Diff', FloatType(), False)
]
attribute_names = [a.name for a in attributes]

@pandas_udf(StructType(attributes), PandasUDFType.GROUPED_MAP)
def fn_calc_diff_from_mean(txn):
    pdf = txn
    amount = pdf.Amount
    pdf = pdf.assign(Diff=amount - amount.mean())
    return pdf

df_map = df.groupby("CustomerID").apply(fn_calc_diff_from_mean)
df_map.show(100)

# Function 3 - Group aggregate function - calculate mean only
@pandas_udf(FloatType(), PandasUDFType.GROUPED_AGG)
def mean_udf(amount):
    return np.mean(amount)

df_agg = df.groupby("CustomerID").agg(mean_udf(df['Amount']).alias("Mean"))
df_agg.show()
Windowing aggregation functions
With pandas UDF, it is also very easy to implement a windowing function now in PySpark. The following is one example based on the previous code:
# Function 4 - Group aggregate function - Windowing function

w = Window \
    .partitionBy('CustomerID') \
    .rowsBetween(Window.unboundedPreceding, Window.unboundedFollowing)
df.withColumn('Mean', mean_udf(df['Amount']).over(w)).show()
Sample output:
+----------+-------------+-----------+-------------+----------+
|CustomerID|TransactionID|     Amount|CreditOrDebit|      Mean|
+----------+-------------+-----------+-------------+----------+
|         1|            0|       -0.0|       Credit|-1.8736675|
|         1|            1|-0.71031237|        Debit|-1.8736675|
|         1|            2| 0.81518084|       Credit|-1.8736675|
|         1|            3|   2.160472|       Credit|-1.8736675|
|         1|            4| -0.3187046|        Debit|-1.8736675|
|         1|            5| -1.4736127|        Debit|-1.8736675|
|         1|            6|-0.48855728|        Debit|-1.8736675|
|         1|            7| -0.6813129|        Debit|-1.8736675|
|         1|            8|  1.2867537|       Credit|-1.8736675|
|         1|            9|  5.5929785|       Credit|-1.8736675|
|         1|           10|  -3.608092|        Debit|-1.8736675|
|         1|           11|  -5.601307|        Debit|-1.8736675|
|         1|           12|   7.228589|       Credit|-1.8736675|
|         1|           13| -2.8038423|        Debit|-1.8736675|
|         1|           14|   9.139387|       Credit|-1.8736675|
|         1|           15|   1.789978|       Credit|-1.8736675|
|         1|           16| -4.7415066|        Debit|-1.8736675|
|         1|           17| -7.2488465|        Debit|-1.8736675|
|         1|           18| -5.9281673|        Debit|-1.8736675|
|         1|           19|  11.272928|       Credit|-1.8736675|
+----------+-------------+-----------+-------------+----------+
only showing top 20 rows
Since this is a windowing aggregation function, the result includes both detail and aggregated values.
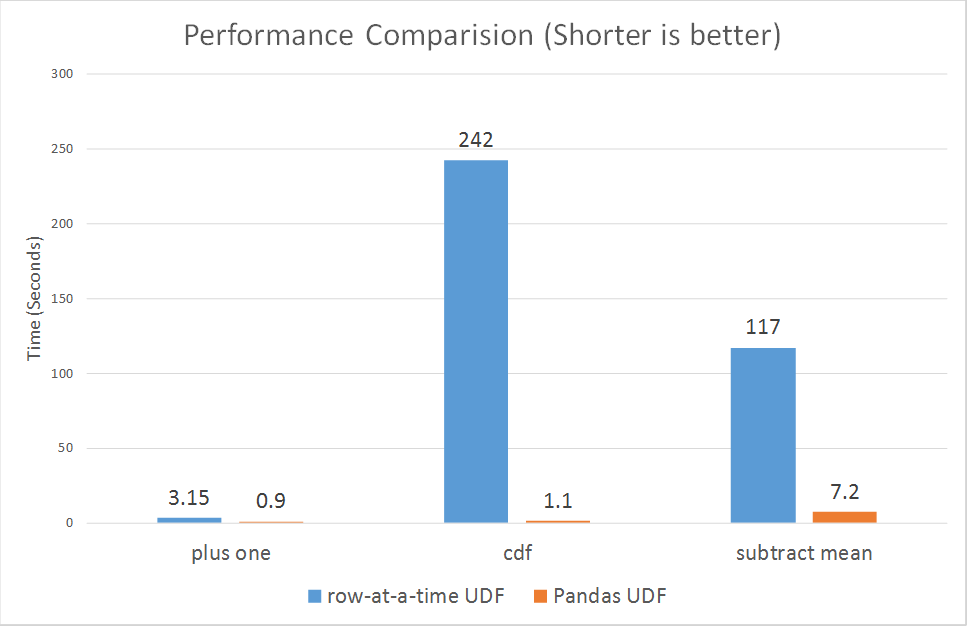
Performance comparison
According to Databricks, Pandas UDFs perform much better than row-at-a-time UDFs across the board, ranging from 3x to over 100x. As I have limited resource in my local cluster in WSL, I can hardly simulate a Spark job with relatively large volume of data. I will share in future if I have a proper environment to test this.
Code repository
The complete code is available in GitHub too. Find more details here.
Summary
As shown in the following diagram, Apache Arrow helps to improve Spark performance via reducing data copy in memory and also reducing data serialization/deserialization overhead. A single copy of data in Arrow can be read by both Java and Python processes. Arrow can also be used in many other programming languages. Through spark.sql.execution.arrow.enabledand spark.sql.execution.arrow.fallback configuration items, we can make the dataframe conversion between Pandas and Spark much more efficient too. Without Arrow, **DataFrame.toPandas()**function will need to serialize data into pickle format to Spark driver and then sent to Python worker processes. The worker processes then need to unpickle each row into list before it is converted to Pandas dataframe. Have fun with Spark + Arrow.
If you have any questions or feedback, please comment here or start a thread in our forums.