Raymond Raymond

Visual Studio Code: Debug ASP.NET Application with Hot Reload

event 2022-03-26 visibility 3,924 comment 4 insights toc
more_vert
insights Stats
Visual Studio Code: Debug ASP.NET Application with Hot Reload

Visual Studio Code is now my favorite development tool and I've migrated all my .NET projects to Code. This article documents the steps to configure a Code launch profile for an ASP.NET Core web application.

Create project

Create a folder named dotnetcore6-web. Open it in Visual Studio Code. 

Open a terminal in the tool and initialize the project using the following command:

dotnet new web

Create a launch.json file

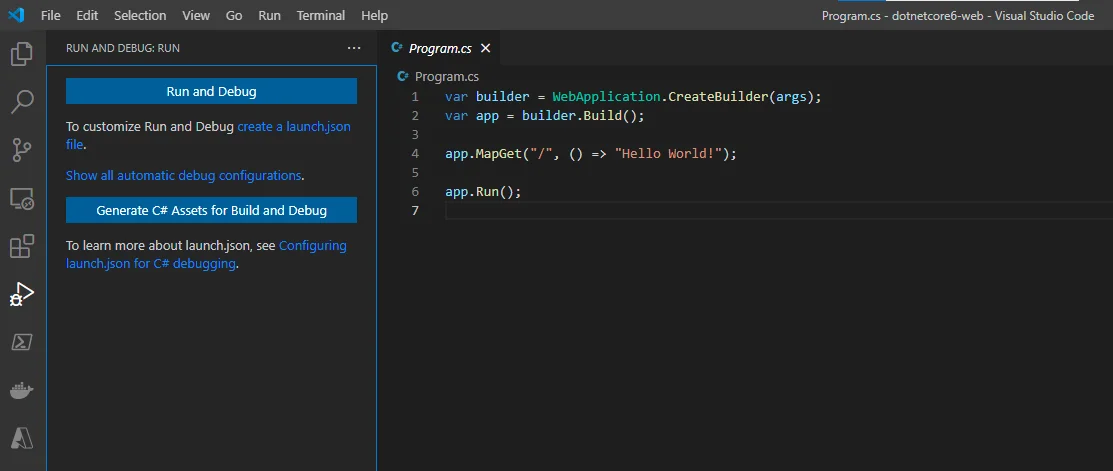
Navigate to Run and Debug tab:
20220326114022-image.png

Click link create a launch.json file

Select .NET 5+ and .NET Core.

20220326114211-image.png

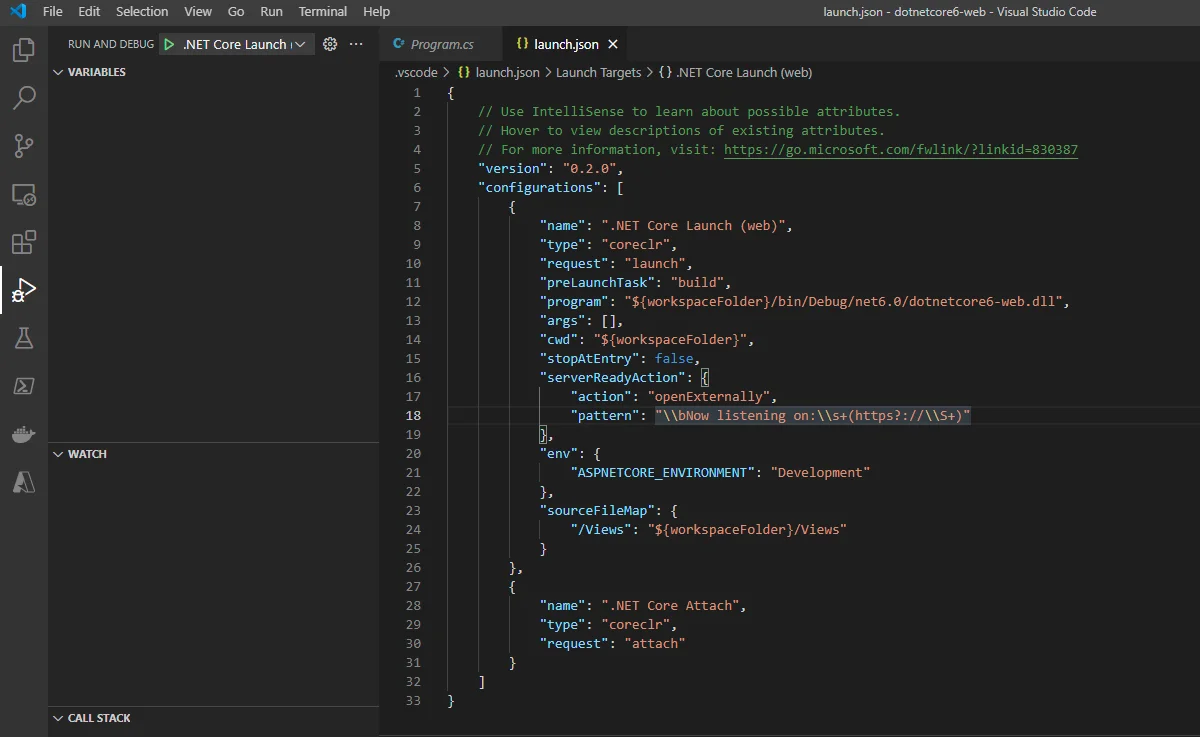
A file named launch.json is created as the following screenshot shows:
20220326114335-image.png

Another file named tasks.json is also created:

{
    "version": "2.0.0",
    "tasks": [
        {
            "label": "build",
            "command": "dotnet",
            "type": "process",
            "args": [
                "build",
                "${workspaceFolder}/dotnetcore6-web.csproj",
                "/property:GenerateFullPaths=true",
                "/consoleloggerparameters:NoSummary"
            ],
            "problemMatcher": "$msCompile"
        },
        {
            "label": "publish",
            "command": "dotnet",
            "type": "process",
            "args": [
                "publish",
                "${workspaceFolder}/dotnetcore6-web.csproj",
                "/property:GenerateFullPaths=true",
                "/consoleloggerparameters:NoSummary"
            ],
            "problemMatcher": "$msCompile"
        },
        {
            "label": "watch",
            "command": "dotnet",
            "type": "process",
            "args": [
                "watch",
                "run",
                "--project",
                "${workspaceFolder}/dotnetcore6-web.csproj"
            ],
            "problemMatcher": "$msCompile"
        }
    ]
}

Some of the tasks will be used later.

Add hot reload launch profile

Update launch.json with the following content:

{
    // Use IntelliSense to learn about possible attributes.
    // Hover to view descriptions of existing attributes.
    // For more information, visit: https://go.microsoft.com/fwlink/?linkid=830387
    "version": "0.2.0",
    "configurations": [
        {
            "name": "debug-hot-reload",
            "type": "coreclr",
            "request": "launch",
            "preLaunchTask": "build",
            "program": "dotnet",
            "args": [
                "watch",
                "--project",
                ".",
                "--verbose"
            ],
            "cwd": "${workspaceFolder}",
            "stopAtEntry": false,
            "serverReadyAction": {
                "action": "openExternally",
                "pattern": "\\bNow listening on:\\s+(https?://\\S+)"
            },
            "env": {
                "ASPNETCORE_ENVIRONMENT": "Development",
                "Key": "Value"
            },
            "sourceFileMap": {
                "/Views": "${workspaceFolder}/Views"
            }
        },
        {
            "name": ".NET Core Attach",
            "type": "coreclr",
            "request": "attach"
        }
    ]
}

Task build is executed before debugging. 

Run and Debug

Now you can click debug-hot-reload to launch the debug in Run and Debug tab.

20220326115235-image.png

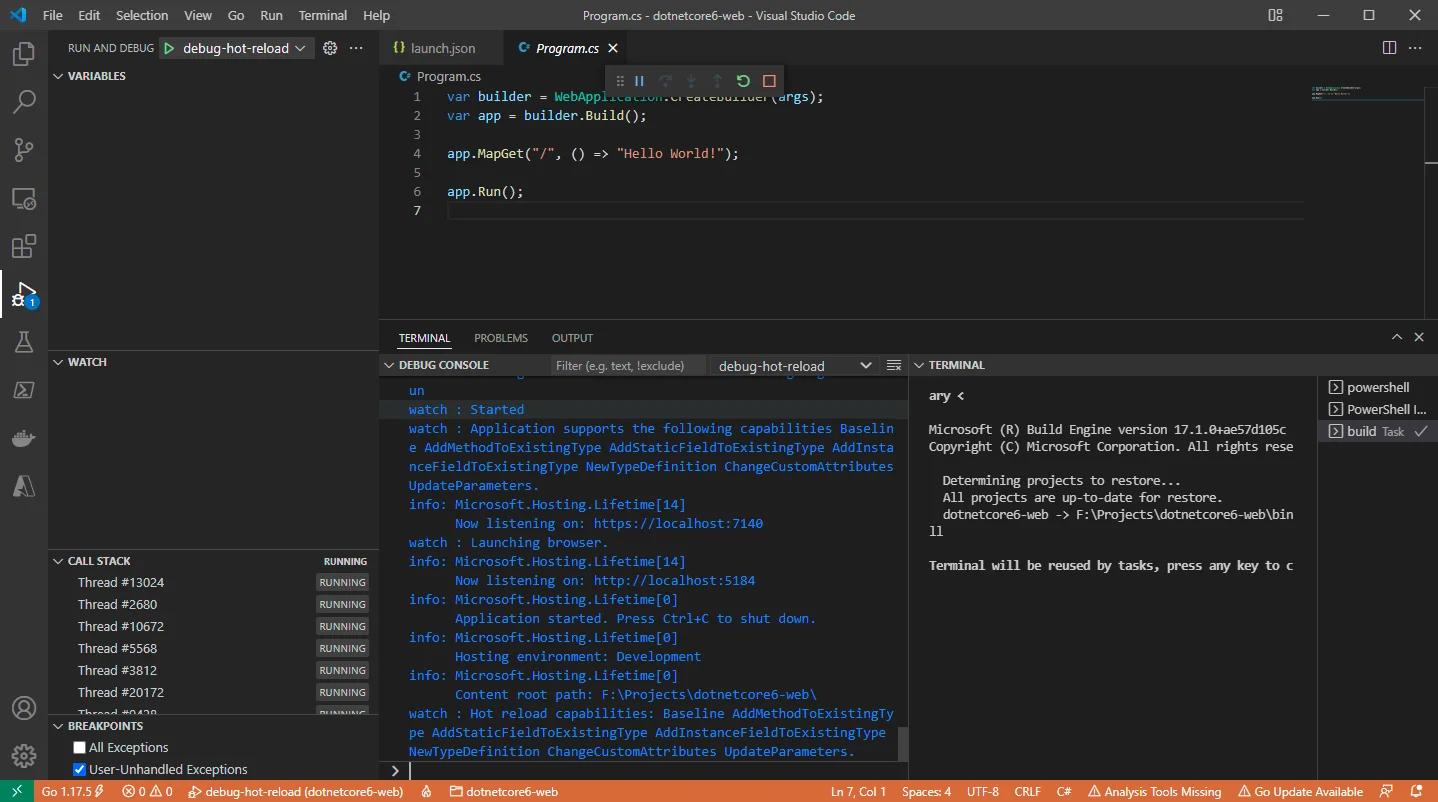
The debug window looks like the following screenshot:
20220326115543-image.png

If you change any code in your project, for example, adding a new view model, the debug window will reload automatically. 

Happy debugging!

More from Kontext
comment Comments
Raymond Raymond #1867 access_time 8 months ago more_vert

Thanks for the info. I will also try the extension.

format_quote

person Firstname access_time 8 months ago

I found this extension which seems to work as expected:

https://github.com/Trottero/dotnet-watch-attach


Would love to see it nativley supported by VS code though. There is an open issue for it:

https://github.com/dotnet/vscode-csharp/issues/4822

F Firstname Lastname #1866 access_time 8 months ago more_vert

I found this extension which seems to work as expected:

https://github.com/Trottero/dotnet-watch-attach


Would love to see it nativley supported by VS code though. There is an open issue for it:

https://github.com/dotnet/vscode-csharp/issues/4822

format_quote

person Raymond access_time 8 months ago

Thanks for the feedbacks. I have verified that the approach doesn't work with debug + hot reload. For now, maybe try just debug without hot reload (i.e. no watch sub command). I will update if I find out an approach.

Raymond Raymond #1863 access_time 8 months ago more_vert

Thanks for the feedbacks. I have verified that the approach doesn't work with debug + hot reload. For now, maybe try just debug without hot reload (i.e. no watch sub command). I will update if I find out an approach.

format_quote

person Firstname access_time 8 months ago

I was excited to see this article but breakpoints don't work for me with this method. Still looking for a way to get breakpoints to work in combination with hot reloading. Any ideas? 

F Firstname Lastname #1861 access_time 8 months ago more_vert

I was excited to see this article but breakpoints don't work for me with this method. Still looking for a way to get breakpoints to work in combination with hot reloading. Any ideas? 

Please log in or register to comment.

account_circle Log in person_add Register

Log in with external accounts