Serial: An Introduction to SQL Server Features
Case Scenario
After the data is loaded into the database, reports can be built using SSRS (SQL Server Reporting Service).
The general requirements for in this scenario are:
- Sales performance in different areas
- Sales amount for different products
- Reports can be subscribed and exported to different formats (Excel, PDF, Word, CSV..)
- Reports are accessible through browsers (IE, Chrome, Firefox…)
Create SSRS Report
Create SSRS project ‘SSRS-Sample’
Create Shared Data Source ‘SalesDS’
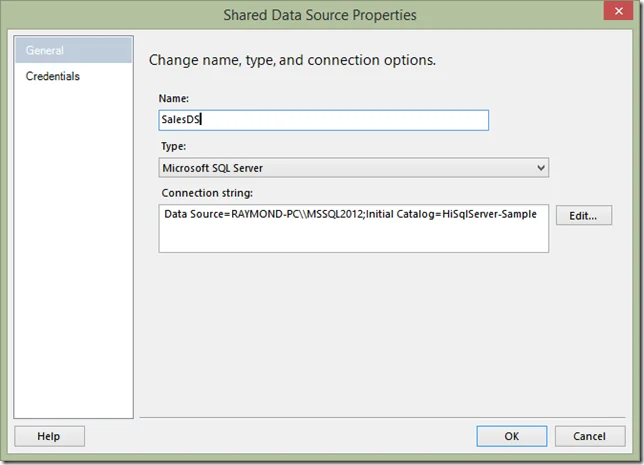
Credentials: using the SQL Server Account.
- Use Report Wizard to create one new report ‘SalesPerformanceDashboard’
Select the Data Source: choose the shared data source ‘SalesDS’
Design the Query: use the following query
SELECT        Areas.AreaName, Products.ProductName, Products.Color, SUM(Sales.Amount) AS Amount
FROM            Areas INNER JOIN
                         Sales ON Areas.AreaId = Sales.AreaId INNER JOIN
                         Products ON Sales.ProductId = Products.ProductId
Group BY   Areas.AreaName, Products.ProductName, Products.Color
Select the Report Type: choose tabular
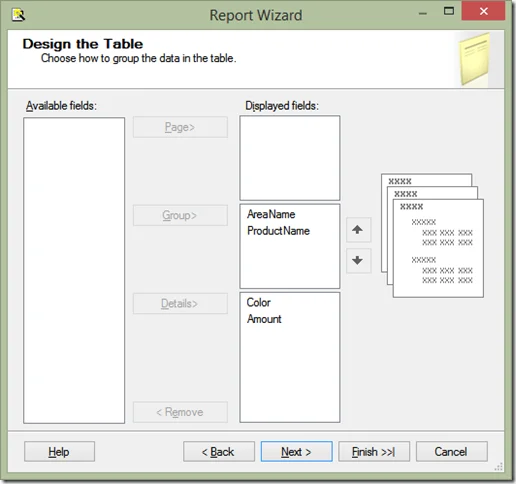
Design the Table:
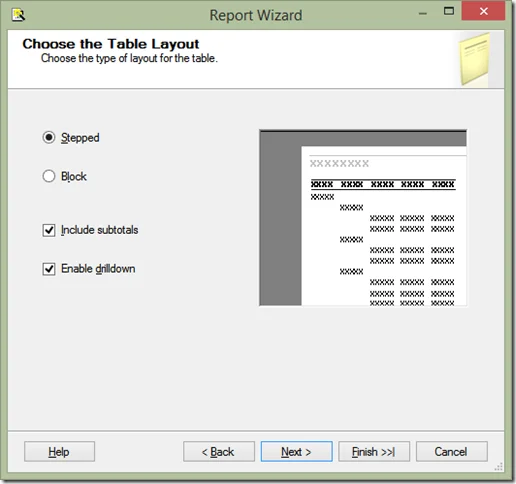
Choose the Table Layout:
Choose the Table Style: choose Corporate
Report Name: input SalesPerformanceDashboard
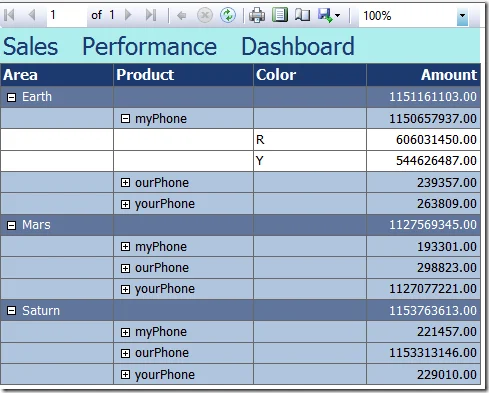
Then you can preview the report in Visual Studio.
- Add charts into the report.
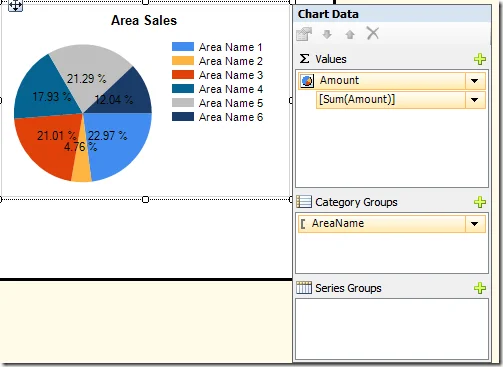
Add chart form Toolbox into the report design area and name is as ‘Area Sales’. Select the report type Pie.
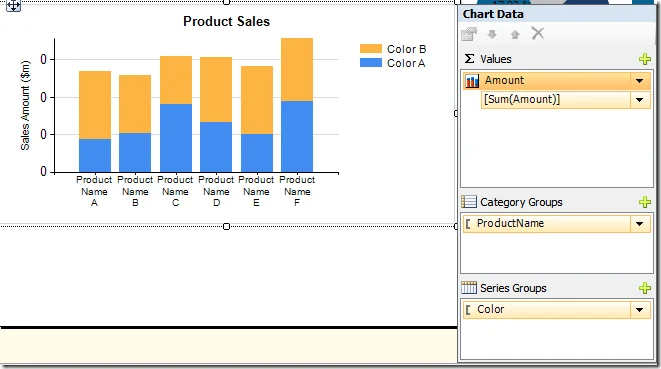
Add another Column chart to show sales by products.
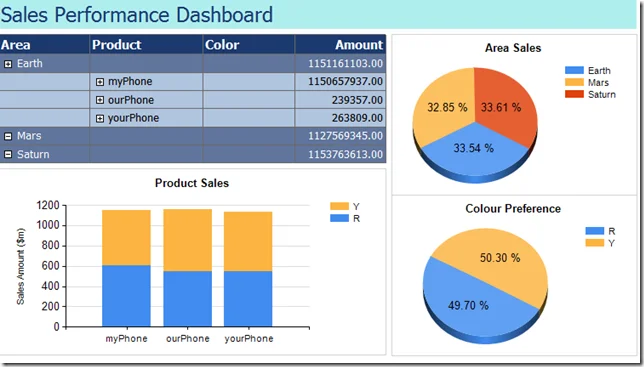
Add the third Pie chart to show sales by Color preferences.
The dashboard looks like the following screenshot:
SSRS Subscriptions
SSRS supports reporting subscriptions which deliver reports through Email, Shared Folder, SharePoint… It can be configured with schedules and data-driven events.
Find out more at <http://msdn.microsoft.com/en-us/library/ms159762.aspx>.